- About
- Admission
- Academics
-
Research
- Research Projects And Publications
- Research & Publications Policies
- CBE Journal
- CBE Institutional Repository
- Researchers' Profiles
- Research Agenda
- Consultancies
- Local Partnerships
- International Partnerships
- BEDC Conference
- Public Lectures
- Research/Publications Updates
- Monthly Researchers
- Partnerships & Exchanges
- Google Scholar
- Services
- Departments
- Consultancies
- Contacts
RESEARCHER OF THE MONTH OF NOVEMBER - DR LEMBRIS NJOTTO
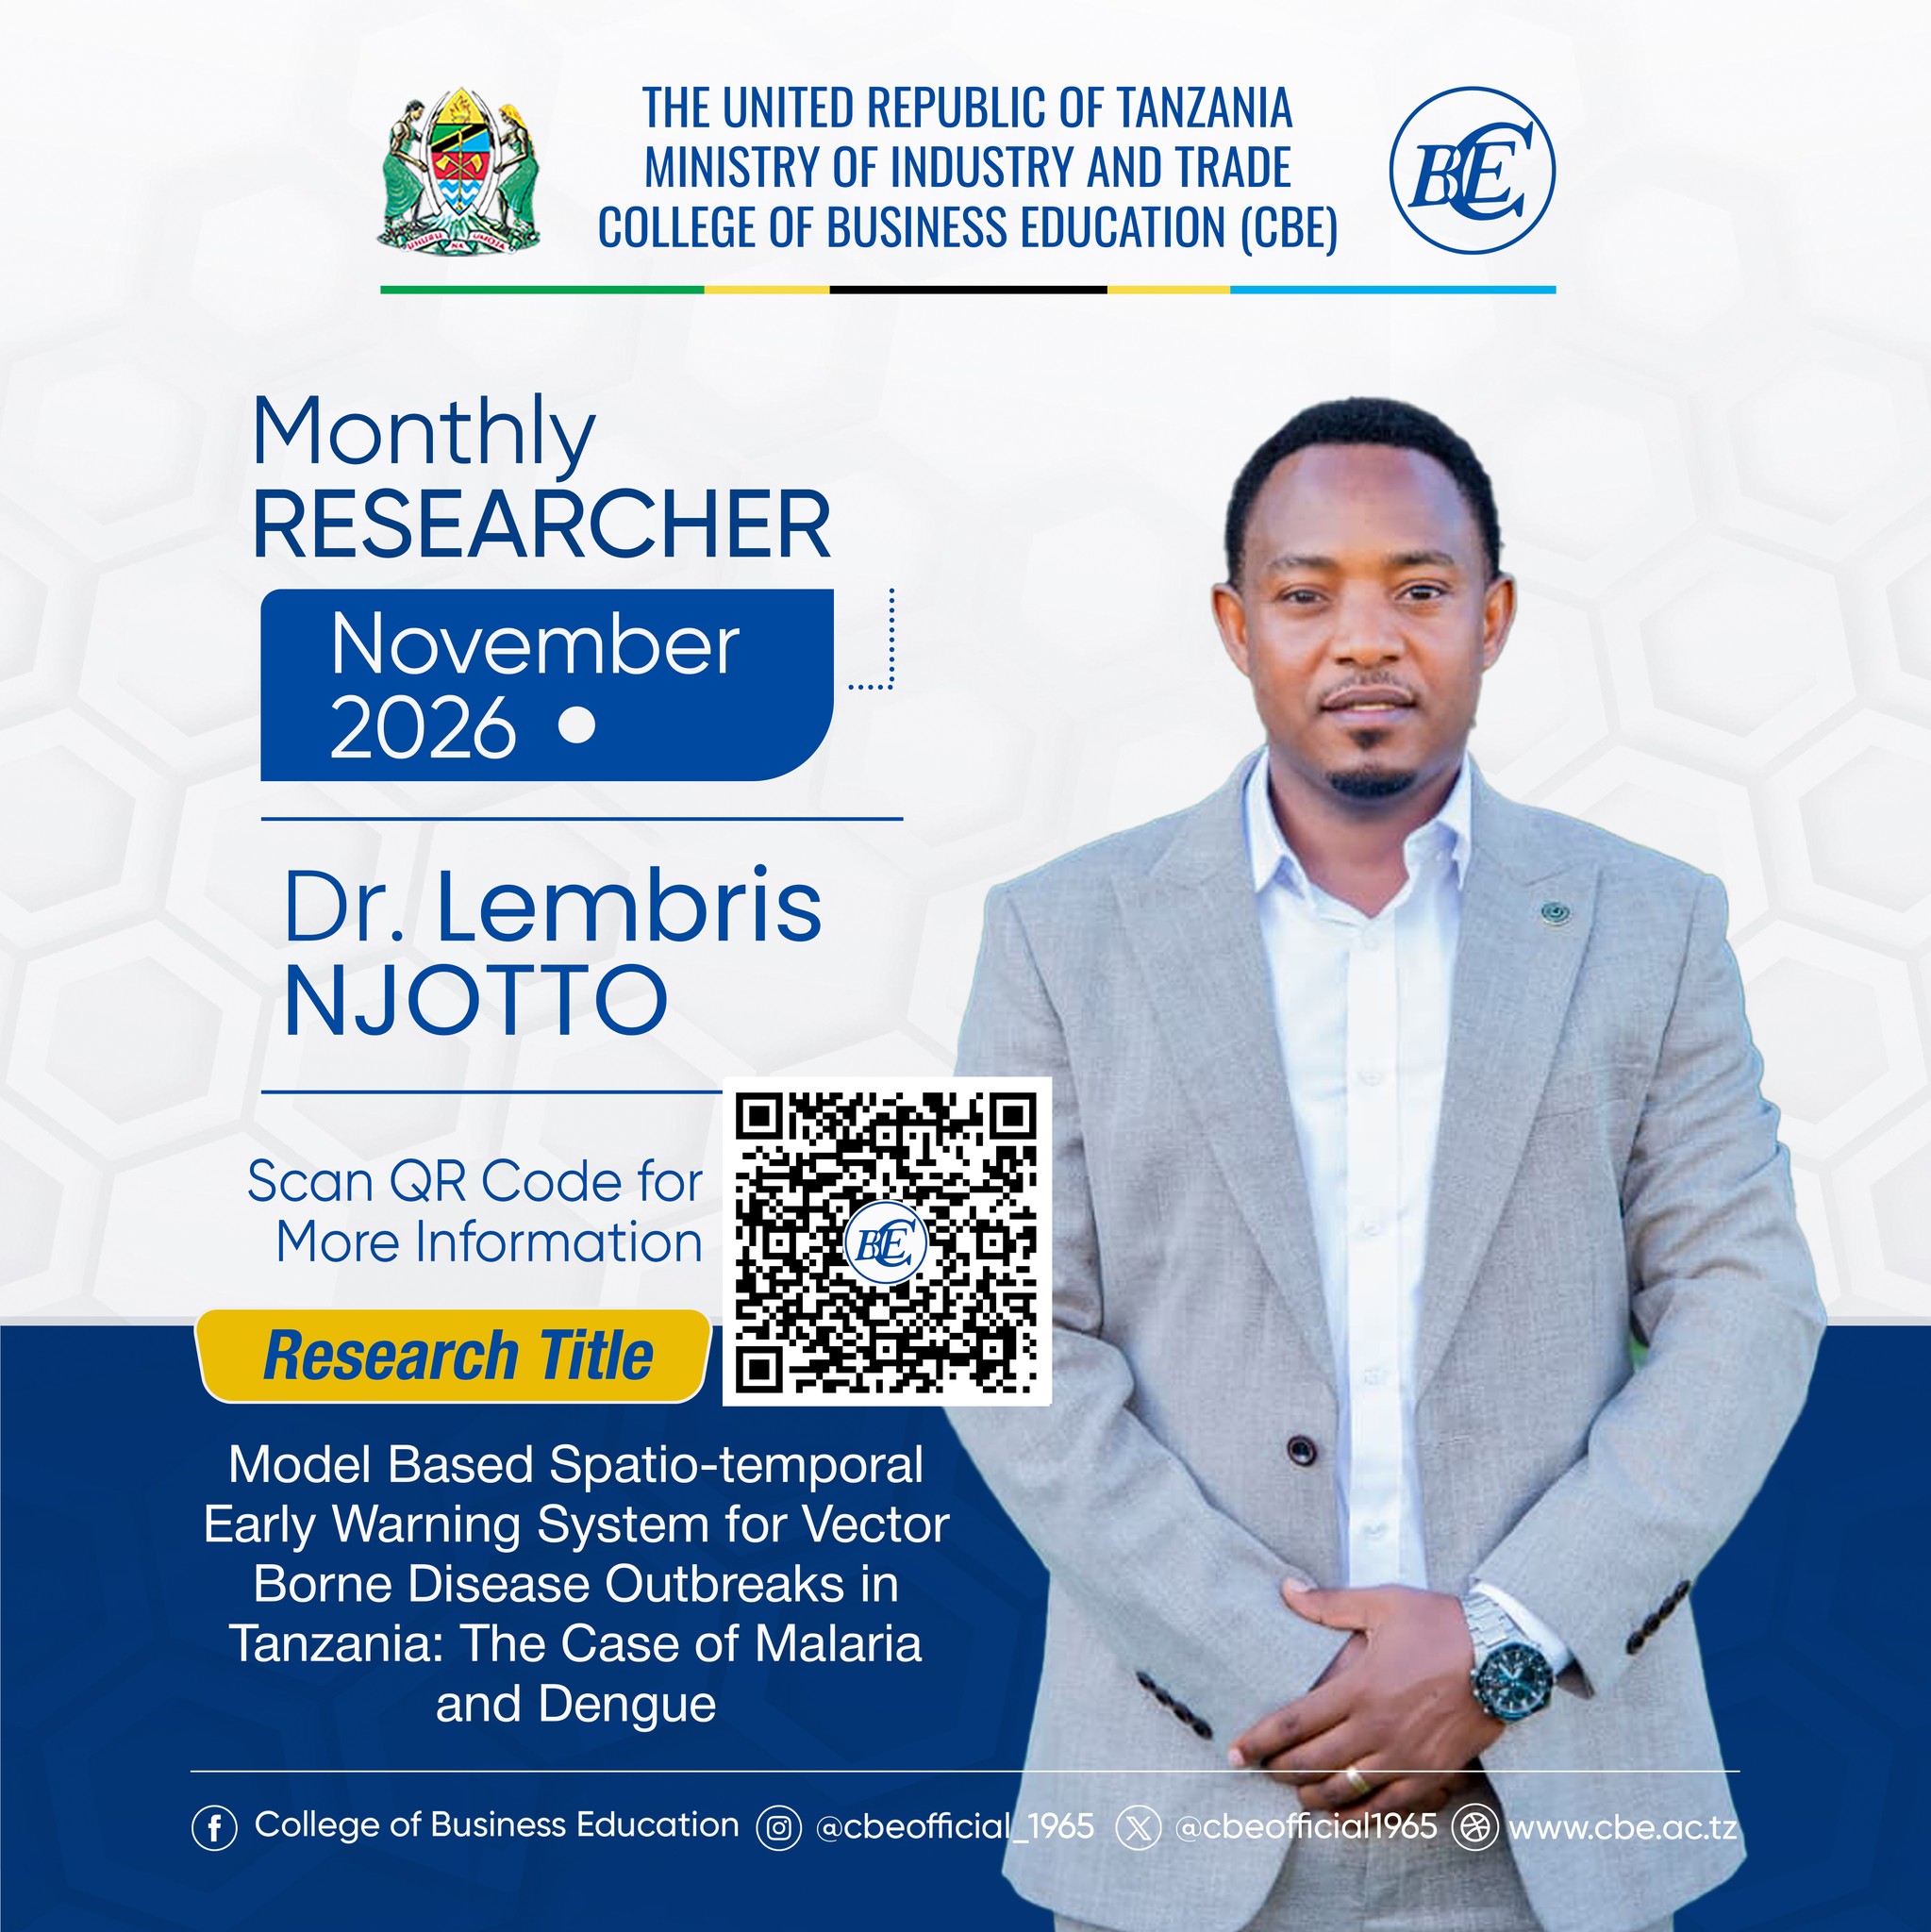
Research Title: Model Based Spatio-temporal Early Warning System for Vector Borne Disease Outbreaks in Tanzania: The Case of Malaria and Dengue
What is the topic of your doctoral research? Why is it important to study the topic?
My doctoral research developed a model-based, spatio-temporal Early Warning System (EWS) that forecasts the abundance of the mosquitoes that transmit malaria (Anopheles) and dengue (Aedes) in Tanzania. The system combines two years of entomological surveillance from Tanga Region (mainland) and Unguja Island (Zanzibar) with climate data, converts the forecasts into outbreak-risk probabilities, and delivers them to decisionmakers through the national District Health Information Software 2 (DHIS2).
This topic is important because malaria and dengue continue to pose substantial and evolving public-health challenges in Tanzania. Malaria accounts for an estimated 7.7 million clinical and confirmed cases each year, and about 93% of the mainland population lives in areas at risk of transmission. According to the WHO 2023 report, Tanzania was among four African countries that together accounted for more than half of global malaria deaths. In Zanzibar, after more than a decade of maintaining malaria prevalence below 1%, nearly 24,000 cases were reported between October 2023 and March 2024. Dengue has also become a recurrent problem, with five mainland outbreaks since 2010, including a major epidemic in 2019 that recorded 6,917 confirmed cases. Dengue virus serotype 2 is now circulating year-round among outdoor-biting Aedes aegypti in Dar es Salaam. At the same time, the interventions that supported earlier progress are under increasing pressure. Insecticide resistance, more frequent outdoor-biting behaviour, and growing variability in temperature, rainfall, and humidity are reducing the effectiveness of bed nets and indoor residual spraying while reshaping the environmental conditions that support mosquito survival. Despite these challenges, surveillance remains largely reactive: most existing models rely on reported cases, which become visible only after transmission has begun, and Tanzania has lacked an operational early-warning system for malaria or dengue. With mosquito population growth occurring prior to increases in human cases, forecasting vector abundance supplies the advance notice needed to intervene before outbreaks intensify.
What are the key findings or observations of your doctoral research?
1Climate drives mosquito abundance in non-linear, species-specific and place-specific ways.
In Tanga, each 1°C increase in maximum temperature increased Anopheles abundance by about 39%, moreover rainfall in the current month and two months earlier increased abundance. In Unguja, Anopheles peaked at an average temperature of 26–27°C and relative humidity of 75–78% and declined at extremes. Aedes increased with humidity and moderate rainfall but declined under excessive rainfall and extreme temperatures, with an optimal maximum temperature of 28–30°C (two-month lag) in Tanga and humidity of 74–78% in Unguja. Many rainfall and temperature effects act with a one- to two-month lag, which gives the system its forecasting lead time.
2Malaria and dengue vectors occupy different settings.
Of 13,376 mosquitoes collected, Anopheles (5,762, mainly An. gambiae) were concentrated in rural sites, with Mtindiro alone contributing 65.7% of Tanga’s catch. Aedes (7,614) were concentrated in urban areas, which accounted for 77.4% of the Aedes collected in Tanga, while the urban shehia (the small administrative unit in Zanzibar) of Malindi accounted for 81.6% in Unguja. Malaria and dengue control therefore need different geographic targeting.
3The models forecast mosquito abundance accurately.
The spatio-temporal models explained 76–99% of the variation (deviance) in mosquito counts. Correlations between observed and predicted or forecasted values ranged from 0.80 to 0.99, and Theil’s U was below 0.5 in every case, well below the benchmark of 1, so the models clearly outperformed naive forecasts. Tested on independent Zanzibar Malaria Elimination Programme (ZAMEP) data that were not used to train the model, the Anopheles model achieved a correlation of 0.99 and correctly identified the peak month. Forecasts for 2024 identified districts with more than 80% probability that mosquito abundance would exceed four times the expected level. For Anopheles these were Muheza (January–April, August and November–December) and Handeni in Tanga, and Kati (July and October–December) in Unguja. For Aedes they were Tanga district (March–June and September–December) and in Unguja (February, May–June and September–October). These periods coincide with the long and short rainy seasons.
How can the results of your doctoral research be utilised in practice?
The forecasts are already integrated into DHIS2 through a purpose-built PreVBD Dashboard Application. District and regional health managers, the National Malaria Control Programme and ZAMEP can see on a colour-coded map (red for high, orange for moderate and yellow for low risk) which districts are likely to exceed outbreak thresholds in the coming months, so they can act before clinical cases appear. Knowing where and when risk will peak allows limited resources, such as indoor residual spraying, bed-net campaigns, community clean-up of breeding sites and awareness campaigns, to be put in place ahead of the peak. For example, malaria vector control can focus on high-risk rural districts such as Muheza and Kati before the rainy-season peaks. The model runs on freely and routinely available satellite climate data, so forecasts can be updated even where continuous mosquito trapping is too costly. When new entomological data become available, they are can be used to refine the model. The results support making routine entomological and climate data collection part of national surveillance, formal data-sharing between the Ministry of Health, the Tanzania Meteorological Authority and academic institutions, training health workers to interpret and act on forecasts, and embedding the EWS in national malaria and dengue strategic plans. The malaria risk maps also help direct resources to persistent hotspots and track the resurgence in Zanzibar. After calibration with local data, the framework can be extended to other regions of Tanzania and to other climate-sensitive vector-borne diseases.
What are the key research methods and materials used in your doctoral research?
This is a multi-phase quantitative design combined a retrospective analysis of routine malaria data with a prospective, two-year longitudinal entomological study. Monthly confirmed malaria cases (mRDT and blood smear) from January 2016 to December 2023 were stratified into children under five and individuals aged five and above. Mainland data were obtained from the Tanzania National Health Portal (DHIS2), and Zanzibar district from ZAMEP. Monthly indoor and outdoor mosquito collections were sampled from 2021 to 2023 at 10 households in each of 15 locations: 11 rural, semi-urban and urban sites across six districts of Tanga, from the coast to the Usambara Mountains, and four shehias in Unguja. Collections used CDC light traps, Furvela tent traps, BG-Sentinel traps (baited with BG-Lure and CO₂) and Prokopack aspirators. Mosquitoes were identified morphologically, households were georeferenced, and all records were checked against the field forms. Independent ZAMEP mosquito data were used for out-of-sample validation. Monthly maximum, minimum and mean temperature, precipitation and relative humidity were obtained from NASA POWER (GPM-IMERG and MERRA-2) and were validated against local weather stations. Wind speed, vegetation index (NDVI, from FAO GIEWS) and altitude were also used.
Standardised incidence ratios and Moran’s I were used to describe the spatial and temporal distribution of malaria risk. Bayesian hierarchical spatio-temporal negative binomial models were fitted using INLA. These models incorporated conditional autoregressive spatial effects, random-walk temporal effects, and Knorr–Held space–time interactions, and were compared using the appropriate information criterions. Mosquito abundance was modelled usingspatio-temporal Generalised Additive Mixed Models fitted by restricted maximum likelihood. Cubic regression splines captured non-linearrelationships with climatic covariates, while quasi-Poisson or zero-inflated Poisson or negative Binomial distributions addressed overdispersion and excess zeros. The models included lagged climate covariates and random effects for site and month. Multicollinearity was assessed using a variance inflation factor threshold of 10, and model selection was guided by AIC, BIC, QAIC, and GCV. Model performance was evaluated using training and test datasets and out-of-sample forecasts, with ROC/AUC, mean absolute error, root mean square error, and Theil’s U as validation measures. Exceedance probabilities, the probability that forecast relative abundance would exceeds an outbreak threshold, were classified as low, medium, or high risk and integrated into DHIS2 through the custom PreVBD Dashboard Application built on the DHIS2 platform.